THE PULSATING VARIABLE STAR VZ CANCRI
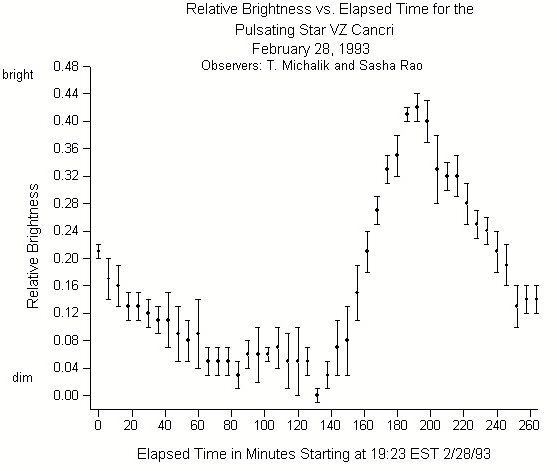
During February, 1993 physics major Sasha Rao and I measured brightness changes during one pulsation of the variable star VZ Cancri. (A variable star designated VZ in the constellation Cancer.) This star exhibits small, relatively rapid pulsations, lasting about 4 hours and 17 minutes per pulse. We chose this star because we could observe a complete pulsation in one night.
It was hard that February to find a 4 hour long stretch of clear cloudless sky. We failed
twice before succeeding on the cold evening of February 28, 1993. On this night we took 45
images of VZ Cancri over a period of 4.5 hours from 7:30 PM until midnight. Each exposure
was 6 seconds long, and we took one picture every 6 minutes. Later, we measured the
brightness of VZ Cancri relative to four nearby comparison stars in the same field of
view. The four comparison stars provide an average star of constant brightness. The
brightness of VZ Cancri relative to the standard stars was measured in all 45 images, and
then plotted against time to produce a graph showing how brightness varied with time. Such
a graph is called a light curve. Our light curve is displayed below.
Think about what this light curve represents. Far away in space a star hundreds of times
bigger than Earth with a power output roughly equal to 100 million billion nuclear power
plants is bulging in and out! What a spectacular sight! We actually watched it!
